



Flexible packaging prices and oil
Laura Ionescu, CFO VLM Poliplast. Published 27 October 2026.
Data updated automatically: Brent to the week ending 6 November 2026, Eurostat producer prices to September 2026, industrial energy prices for the first half of 2026.
Flexible packaging prices are set by the cost of the film, the cost of converting it and the order itself. The order means structure, thickness, size, print and quantity. Oil reaches that price through three channels: polymer feedstocks, energy and freight.
Each link between a barrel of crude and a reel of film has its own market, stocks and contracts. A 10% rise in crude does not turn into a 10% rise in packaging prices. A fall in crude does not reach a quote the following week either.
Contents
- What sets the price of flexible packaging
- Is plastic made from oil?
- Are plastic prices going up?
- Why cheaper oil does not mean cheaper packaging straight away
- The Strait of Hormuz, the Red Sea and packaging costs
- Brent crude price, weekly average
- Official indicators for packaging buyers
- How to budget for packaging when prices move
What sets the price of flexible packaging
The price of flexible packaging has two parts: materials and converting. Materials are bought at the market price of the day of purchase. Converting depends on machinery, energy, labour and the size of the order.
| Cost component | What drives it | Link to oil |
|---|---|---|
| Film | Polymer type, structure and thickness, which together set the mass of material per square metre | Through the petrochemical feedstocks of each polymer; the link differs by polymer and by region |
| Adhesives and inks | Laminated and printed area, number of colours | Indirect, through supply markets separate from the polymer market |
| Energy | Power and heat for printing, lamination, slitting and pouch making | Indirect, through electricity and gas markets |
| Freight | Distance, volume and mode of transport, for raw materials and finished packaging | Through diesel and, on sea routes, through freight rates, which also reflect route risk and vessel capacity |
| Exchange rate | The currency of the raw materials against the currency of the invoice | Crude oil is priced in US dollars; a stronger dollar amplifies an oil rise for buyers paying in euro or sterling, a weaker dollar softens it |
| Order set-up | Artwork, print tooling, machine make-ready | None directly |
| Quantity | The number of pouches or linear metres that fixed costs are spread over | None directly |
The polymer in the film carries most of the link to oil. Polyethylene (PE), polypropylene (PP), polyethylene terephthalate (PET) and polyamide (PA) each follow their own feedstock market. The grades are covered in LDPE and LLDPE, polypropylene packaging, PET film and polyamide (nylon) film.
A change in the film price moves the packaging price in proportion to the film’s share of that price. The share grows with quantity, because fixed costs are spread over more units. For example, a small run and a much larger run of the same structure carry the same set-up cost. In the larger run the film makes up more of each unit price, so the same film price change moves that unit price more.
Costs that sit outside the packaging price
Some costs of plastic packaging are paid by the brand owner or importer, not invoiced by the converter. In the European Union (EU), companies placing packaging on the market pay extended producer responsibility (EPR) fees to their national scheme. The Packaging and Packaging Waste Regulation (PPWR) changes how those fees are structured, as set out in eco-modulation of EPR fees.
In the United Kingdom, Plastic Packaging Tax is charged at £228.82 per tonne of finished plastic packaging components with less than 30% recycled plastic. Registration starts at 10 tonnes of finished components, manufactured or imported, over the past 12 months or expected in the next 30 days[1]. Supplier price, these costs, duties and freight add up to the landed cost, compared in EU vs overseas sourcing.
Is plastic made from oil?
Plastic is made from petrochemical feedstocks of crude oil refining and natural gas processing, not from crude oil directly. Naphtha comes from refining; ethane and propane are separated from natural gas. Steam crackers turn these feedstocks into ethylene and propylene, which are polymerised into PE and PP[2].
The dominant feedstock differs by region. Naphtha is the most common cracker feedstock in Western Europe and East Asia[3]. In the United States, cracking ethane has historically paid better than cracking naphtha[3]. US ethane is consumed almost exclusively by the petrochemical industry, in steam crackers producing ethylene[4].
PET and PA start from other petrochemical intermediates, each with a market of its own. A laminate of several materials depends on several feedstock markets at once. Extruded base films such as BOPE film are printed, laminated and slit into packaging film for automatic lines, or made into custom pouches.
Why the feedstock matters for price
The feedstock decides which energy market a polymer is exposed to. Naphtha comes from crude oil refining, so a polymer cracked from naphtha sits closer to the crude oil price. Ethane comes from natural gas processing and costs less than propane and naphtha[2]. Cracking ethane in the United States has therefore historically earned higher margins than cracking naphtha[3].
Most crackers have some flexibility to switch between ethane and naphtha, depending on which pays better[3]. A PE film bought in Europe and one bought in the United States respond differently to the same oil move. Resin price news from one market does not transfer to the other.
Are plastic prices going up?
In the European Union, plastic prices in 2026 have been higher than a year earlier, but polymer prices have been falling since May 2026. Between May and August 2026, the EU producer price index for plastics in primary forms fell by 4.5%[5]. The Eurostat chart updates each month with the latest plastic prices.
The two price indices moved at different speeds. From February to May 2026, polymer prices rose by 20.1% and packaging prices by 7.6%. Packaging prices kept rising until July, to 9.5% above February, and fell by 0.6% in August[5].
EU producer prices: polymers and plastic packaging, index 2021=100
Plastic packaging goods
121.8
September 2026, +7.0% on September 2025
Plastics in primary forms
113.3
September 2026, +12.0% on September 2025
Source: Eurostat, producer prices in industry, monthly data, European Union (27 countries), total market (domestic and non-domestic), not seasonally adjusted. Labelled values are the highs of the period shown. Data last retrieved: 17 November 2026, 10:27.
In the EU classification of economic activities (NACE), class 22.22 covers all plastic packaging goods, not only flexible packaging. Both series describe the European market as a whole, not how a single supplier passes on costs. Commercial resin price indices, which US and UK sources often call “resin prices”, are published privately and on different bases.
New orders are priced on the costs of the day. Two quotes for the same specification, issued weeks apart, can differ even when crude has not moved, because polymers have their own supply and demand.
Why cheaper oil does not mean cheaper packaging straight away
Lower oil prices reach packaging with a delay, because material in stock was bought at the earlier price. Polymer producers, film producers and converters each hold stock and run contracts. A change in crude passes through the chain one link at a time. Replacement cost, the price of buying the material again, speeds the change up.
Costs unrelated to oil do not fall with crude: labour, machine maintenance and order set-up stay the same. Energy and freight follow markets of their own. Refined products also move apart from crude and from each other, so diesel for transport and naphtha for cracking can diverge in the same month.
The Strait of Hormuz, the Red Sea and packaging costs
The Strait of Hormuz links the Persian Gulf with the Gulf of Oman and the Arabian Sea. Around a quarter of the world’s seaborne oil trade passed through the Strait of Hormuz in 2025. The war in the region began on 28 February 2026 and disrupted that traffic. On 11 March, member countries of the International Energy Agency (IEA) agreed the largest emergency oil stock release in IEA history[6].
U.S. Energy Information Administration (EIA) data put flows through the strait at 4.9 million barrels per day in the second quarter of 2026, against 21.6 million in the last quarter of 2025[7]. The IEA reports that the losses extend to the petrochemical feedstocks used to make plastics[6].
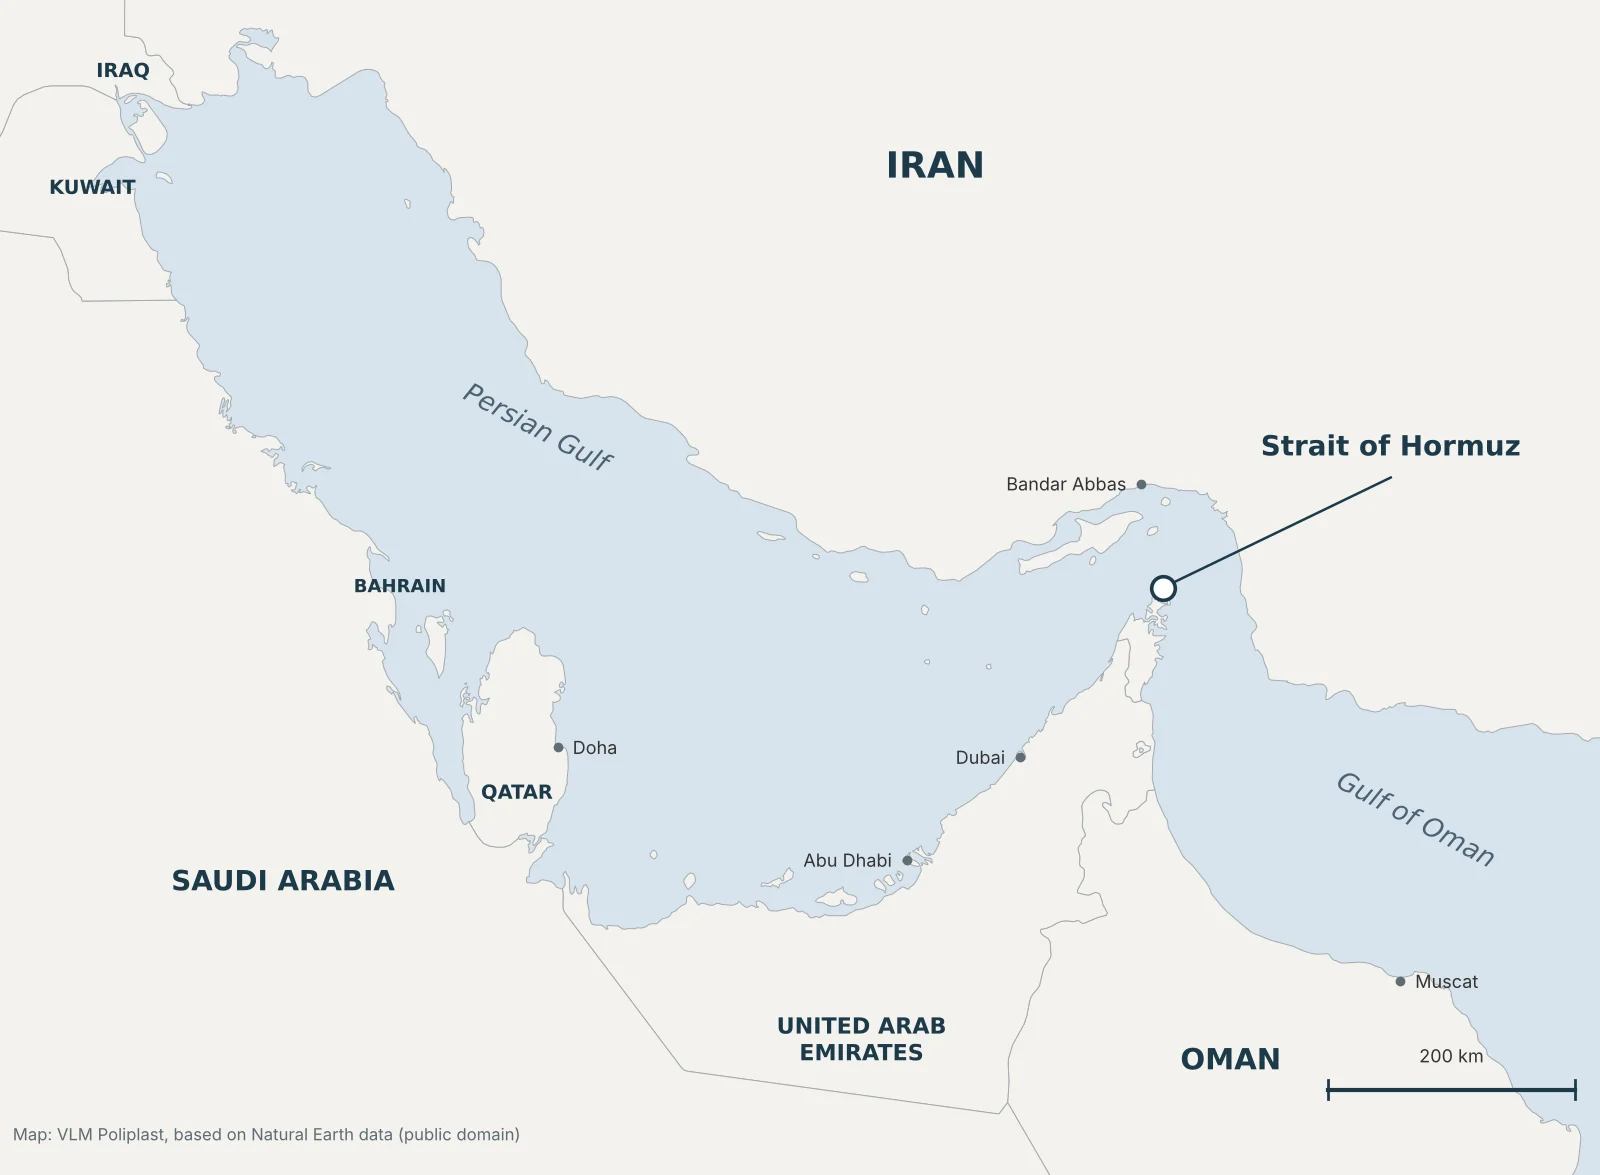
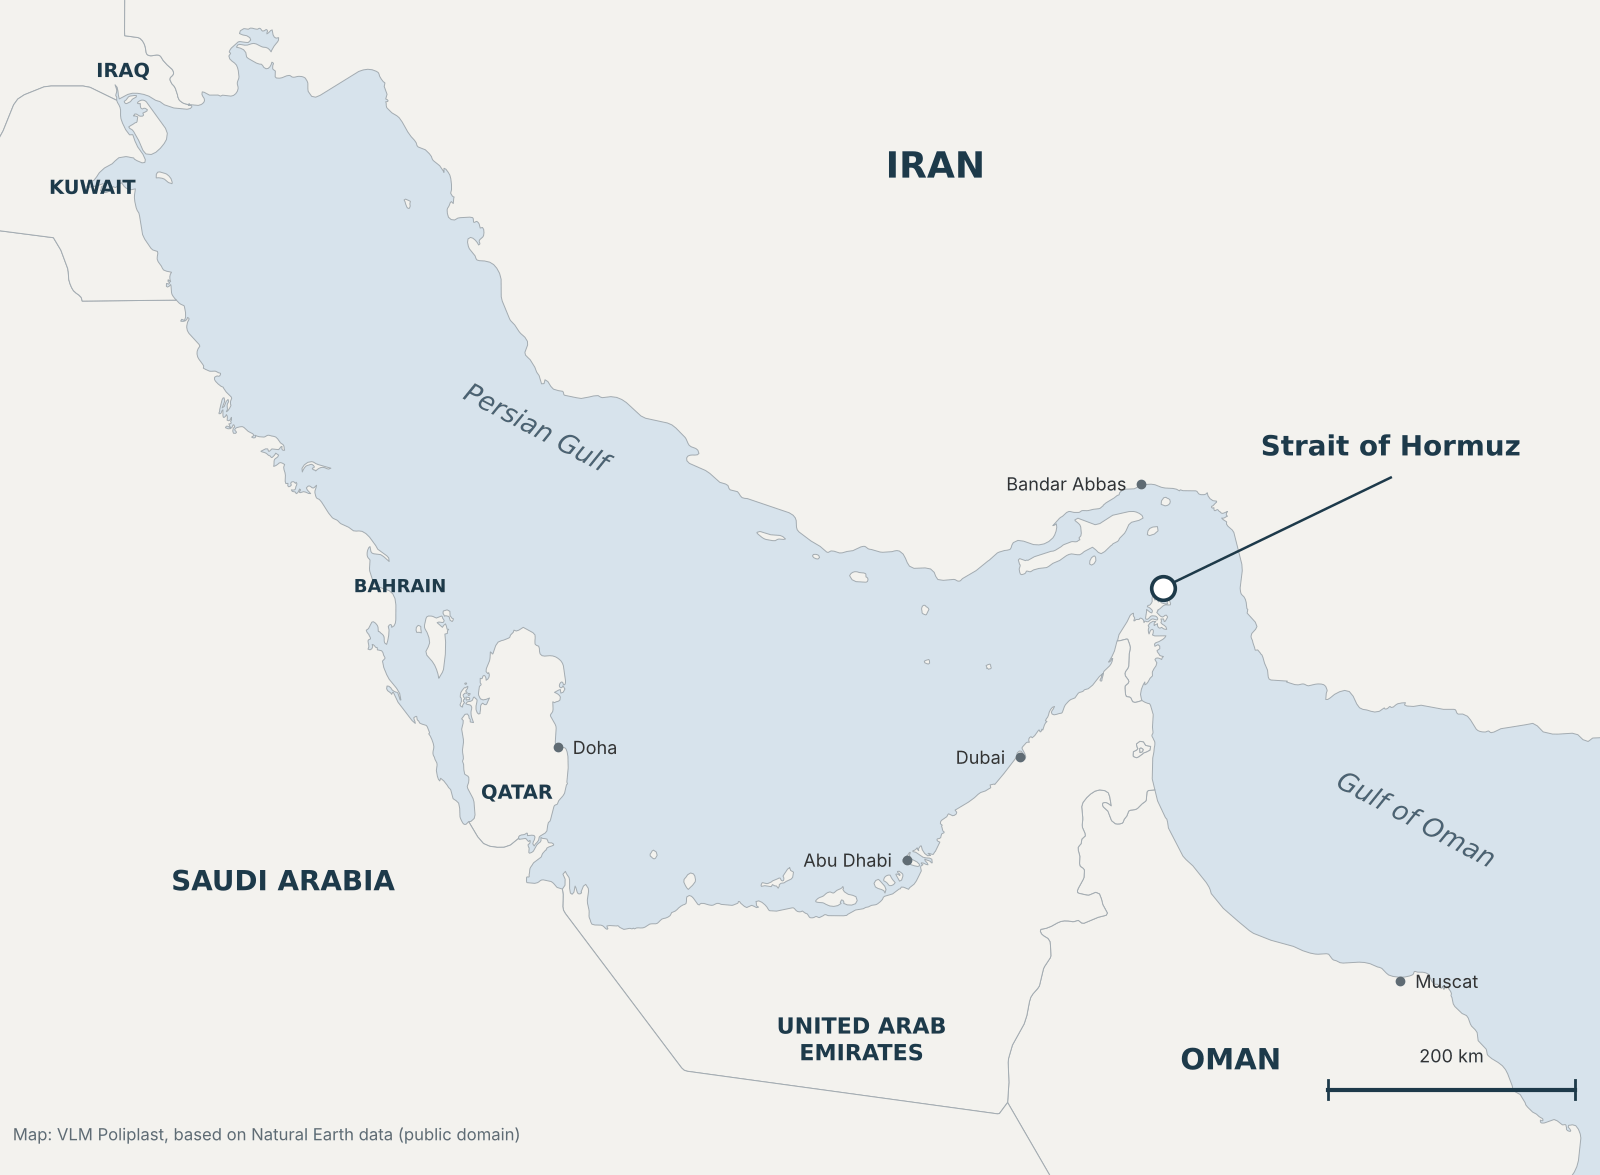
A disruption at Hormuz reaches packaging by three routes:
- the price of crude and refined products;
- the cost of shipping and diesel;
- the supply of liquefied petroleum gases (LPG), which are also petrochemical feedstocks.
Oil flows through the main shipping chokepoints
The table gives crude oil and petroleum liquids moved through each chokepoint, in million barrels per day. It compares the last quarter of 2025, before the war, with the second quarter of 2026[7].
| Route | Connects | 4Q 2025 | 2Q 2026 |
|---|---|---|---|
| Strait of Malacca | Indian Ocean and Pacific Ocean | 24.9 | 16.6 |
| Strait of Hormuz | Persian Gulf and Gulf of Oman | 21.6 | 4.9 |
| Cape of Good Hope | Route around Africa, the alternative to the Red Sea | 9.9 | 9.4 |
| Bab el-Mandeb | Red Sea and Gulf of Aden | 5.4 | 8.1 |
| Suez Canal and SUMED pipeline | Red Sea and Mediterranean Sea | 5.9 | 5.8 |
| Danish straits | Baltic Sea and North Sea | 5.0 | 4.7 |
| Turkish straits (Dardanelles) | Black Sea and Mediterranean Sea | 3.7 | 4.1 |
| Panama Canal | Pacific Ocean and Atlantic Ocean | 2.8 | 3.2 |
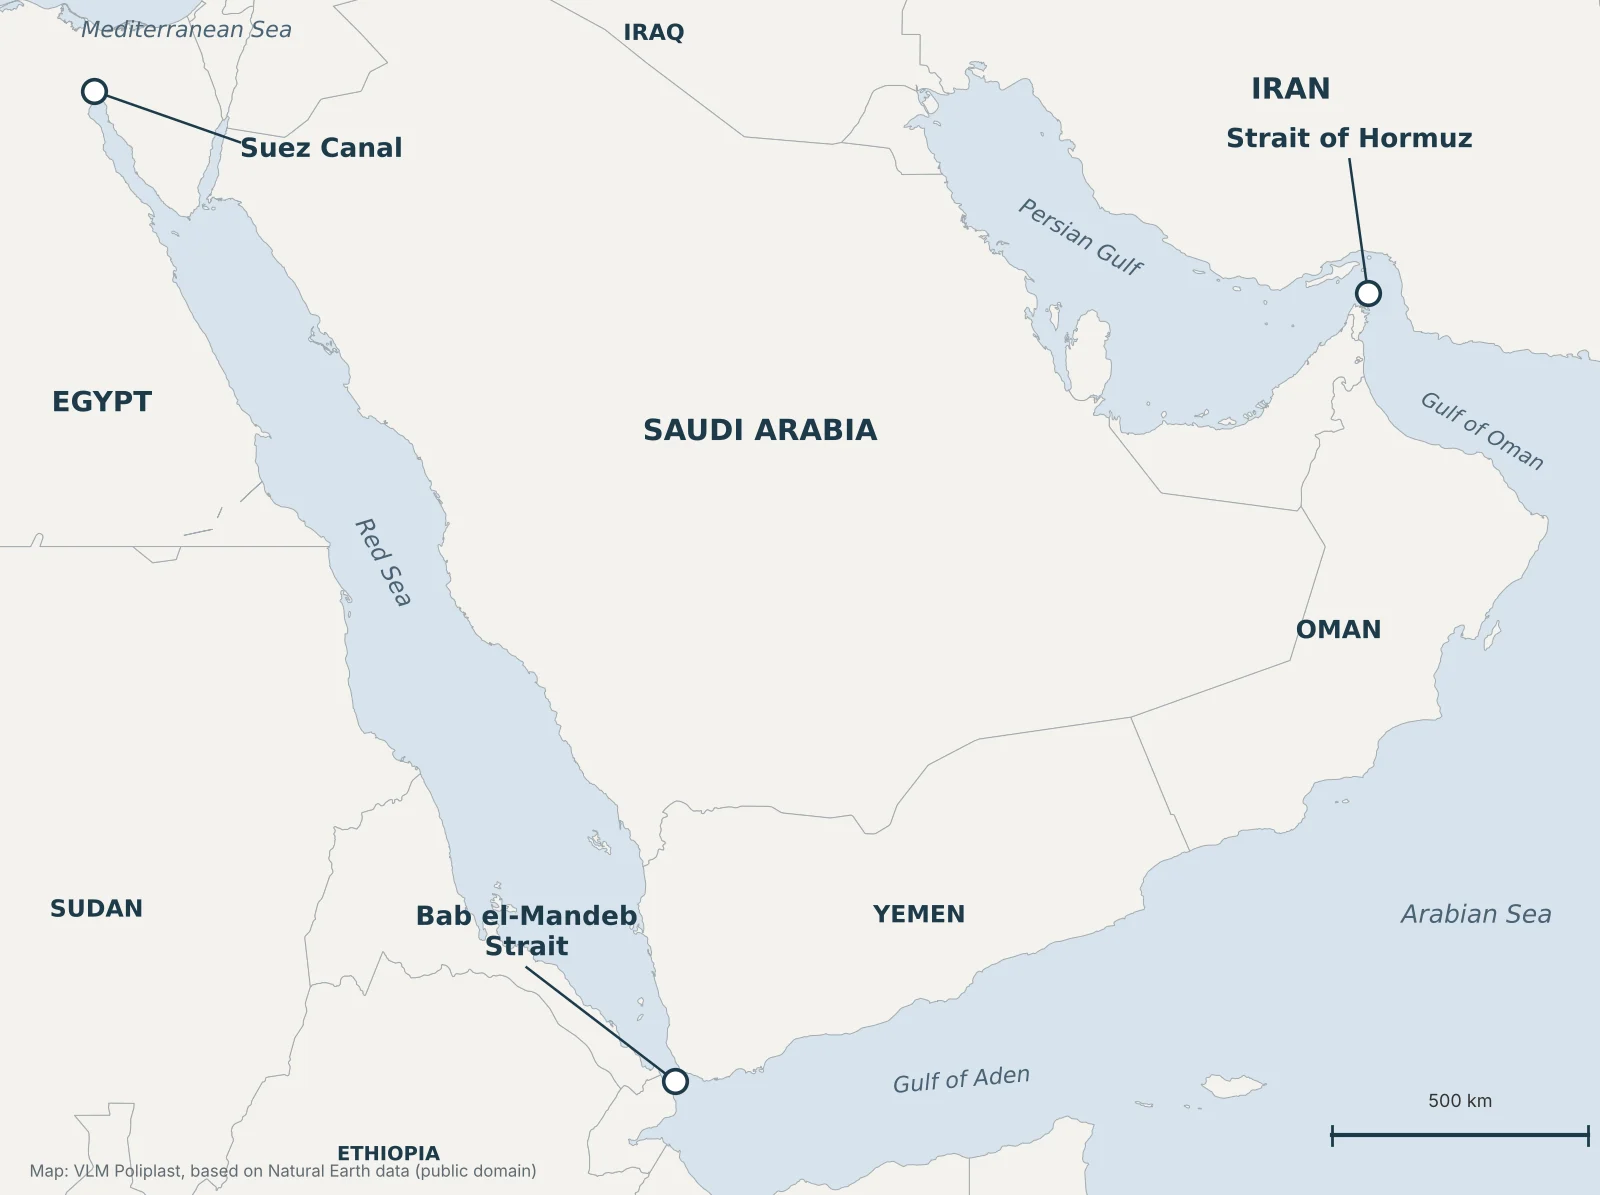
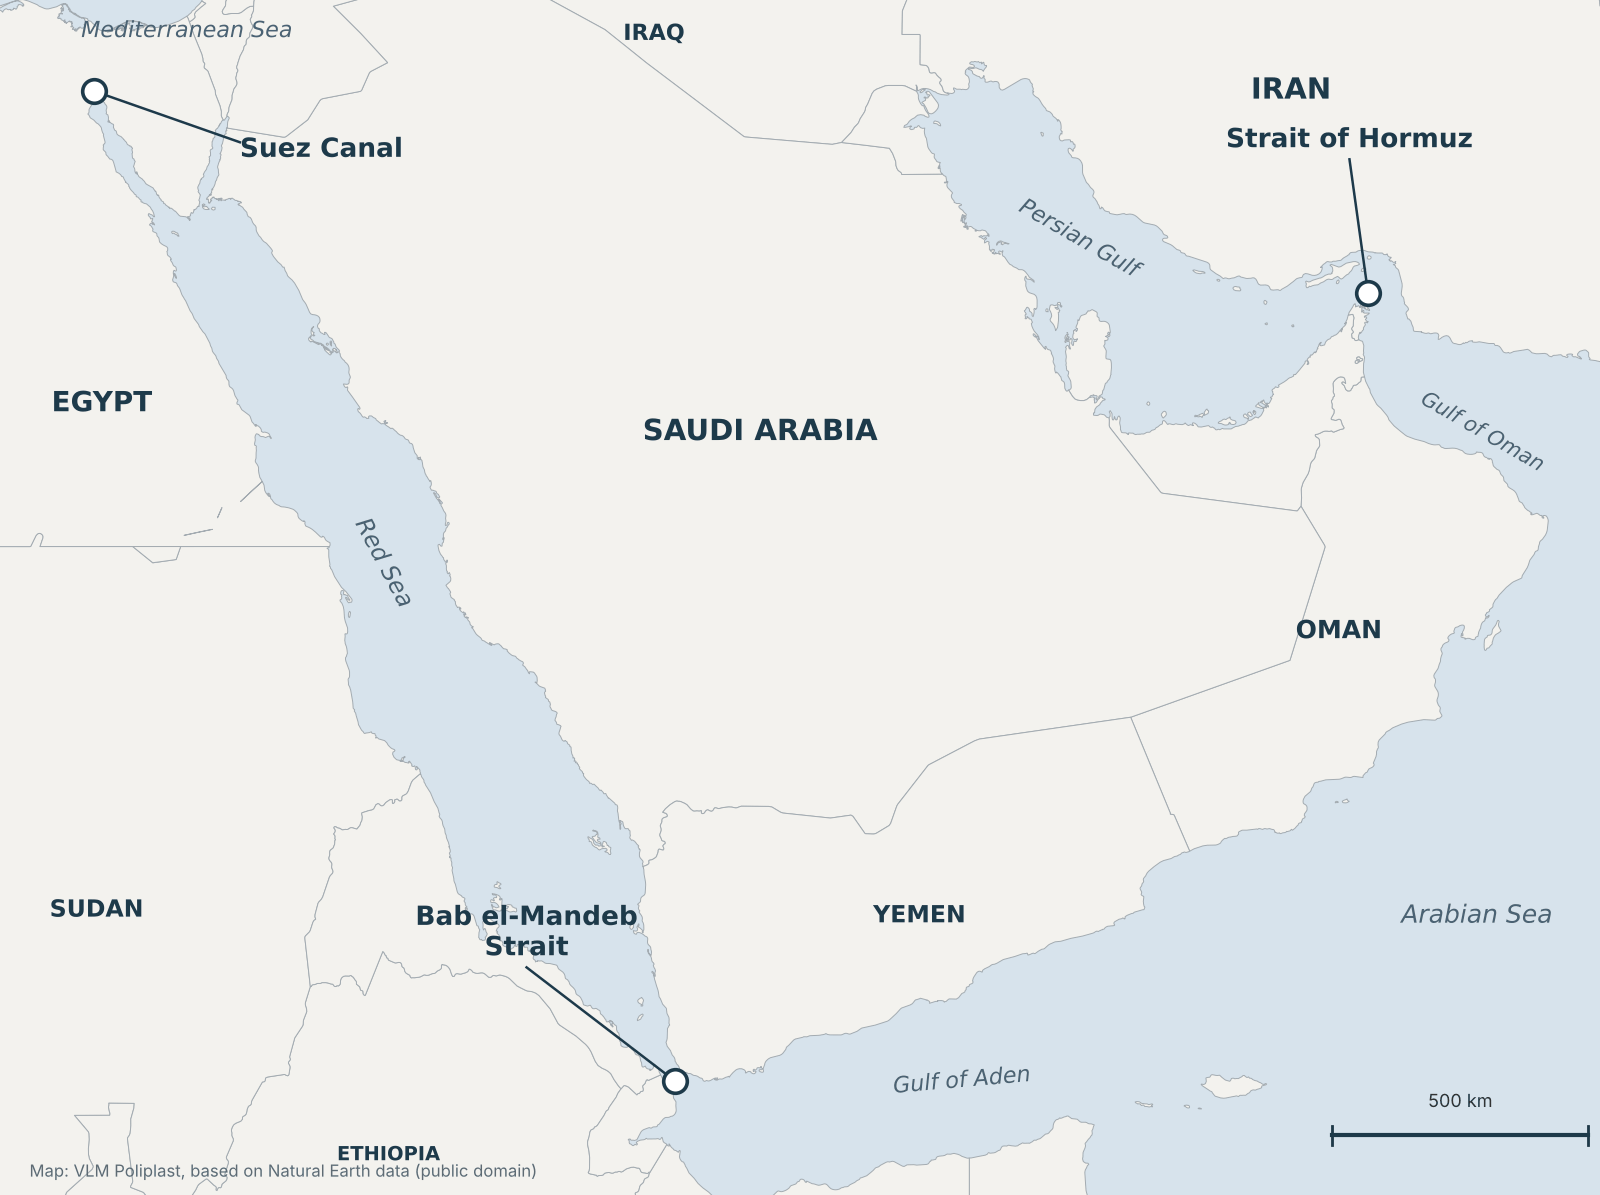
Most Gulf exports to Europe cross three of these points on one voyage: Hormuz, Bab el-Mandeb, then the Suez Canal or the SUMED pipeline. The EIA notes that tracking data for Hormuz transits have been unreliable since late February 2026, so the Hormuz figures are revised often[7].
Brent crude price, weekly average
The Brent chart follows the EIA series Europe Brent Spot Price, free on board (FOB): the weekly average of daily spot prices, in US dollars per barrel, for weeks ending on Friday[9]. Brent spot prices differ from the futures quotes reported in the press. The gap widens when markets are tight.
The EIA October 2026 Short-Term Energy Outlook forecasts Brent at $105 per barrel in the fourth quarter of 2026. Brent then eases to $87 by the second quarter of 2027. The forecast assumes Middle East oil flows stay constrained through the fourth quarter. Global inventories fell by an average of 1.9 million barrels per day in the third quarter[10].
Weekly average Brent price, USD per barrel
Latest weekly average
100.41 USD/bbl
week ending 6 November 2026
Same average in euro
89.93 EUR/bbl
ECB reference rate of 6 November 2026: 1 EUR = 1.1165 USD
Change on previous week
−20.76 USD
−17.1%, from 121.17 USD/bbl
Source: U.S. Energy Information Administration (EIA), Europe Brent Spot Price FOB, weekly averages of daily spot prices, weeks ending Friday. The euro value converts the weekly average at the European Central Bank reference rate for the last day of the week with a published rate. Data last retrieved from the EIA: 17 November 2026, 10:27.
Weekly values, last 12 months
| Week ending | USD/bbl | Weekly change (USD) |
|---|---|---|
| 6 November 2026 | 100.41 | −20.76 |
| 30 October 2026 | 121.17 | +0.15 |
| 23 October 2026 | 121.02 | −4.57 |
| 16 October 2026 | 125.59 | −1.84 |
| 9 October 2026 | 127.43 | +7.40 |
| 2 October 2026 | 120.03 | +2.95 |
| 25 September 2026 | 117.08 | −7.07 |
| 18 September 2026 | 124.15 | +12.32 |
| 11 September 2026 | 111.83 | +12.74 |
| 4 September 2026 | 99.09 | +9.36 |
| 28 August 2026 | 89.73 | −4.47 |
| 21 August 2026 | 94.20 | +1.69 |
| 14 August 2026 | 92.51 | +4.65 |
| 7 August 2026 | 87.86 | −3.77 |
| 31 July 2026 | 91.63 | −4.49 |
| 24 July 2026 | 96.12 | +13.19 |
| 17 July 2026 | 82.93 | +9.60 |
| 10 July 2026 | 73.33 | +3.63 |
| 3 July 2026 | 69.70 | −3.93 |
| 26 June 2026 | 73.63 | −7.37 |
| 19 June 2026 | 81.00 | −12.76 |
| 12 June 2026 | 93.76 | −5.19 |
| 5 June 2026 | 98.95 | +1.90 |
| 29 May 2026 | 97.05 | −13.56 |
| 22 May 2026 | 110.61 | +0.08 |
| 15 May 2026 | 110.53 | +4.65 |
| 8 May 2026 | 105.88 | −13.75 |
| 1 May 2026 | 119.63 | +10.01 |
| 24 April 2026 | 109.62 | −4.81 |
| 17 April 2026 | 114.43 | −10.18 |
| 10 April 2026 | 124.61 | +0.67 |
| 3 April 2026 | 123.94 | +12.70 |
| 27 March 2026 | 111.24 | −0.16 |
| 20 March 2026 | 111.40 | +15.24 |
| 13 March 2026 | 96.16 | +10.88 |
| 6 March 2026 | 85.28 | +13.92 |
| 27 February 2026 | 71.36 | −0.30 |
| 20 February 2026 | 71.66 | +0.96 |
| 13 February 2026 | 70.70 | +0.86 |
| 6 February 2026 | 69.84 | −0.59 |
| 30 January 2026 | 70.43 | +3.44 |
| 23 January 2026 | 66.99 | −0.01 |
| 16 January 2026 | 67.00 | +4.07 |
| 9 January 2026 | 62.93 | +0.75 |
| 2 January 2026 | 62.18 | −1.03 |
| 26 December 2025 | 63.21 | +2.38 |
| 19 December 2025 | 60.83 | −1.77 |
| 12 December 2025 | 62.60 | −1.38 |
| 5 December 2025 | 63.98 | −0.40 |
| 28 November 2025 | 64.38 | +0.74 |
| 21 November 2025 | 63.64 | +0.77 |
| 14 November 2025 | 62.87 |
Official indicators for packaging buyers
Six official indicators track the cost drivers of flexible packaging. They are published by the EIA, the European Central Bank, Eurostat, the European Commission and the IEA. The indicators describe the market; they are not an indexation formula for VLM Poliplast quotes.
| Indicator | What it shows | Frequency | Source |
|---|---|---|---|
| Brent crude price | Crude oil, in US dollars per barrel | Weekly | EIA[9] |
| EUR/USD and other euro reference rates | Conversion of dollar-priced raw materials into the invoice currency, including sterling | Daily, on working days | European Central Bank[11] |
| Producer prices for polymers and plastic packaging | Raw material and finished goods prices in the European Union | Monthly | Eurostat[5] |
| Diesel prices in EU member states | Road freight cost | Weekly | European Commission, Weekly Oil Bulletin[12] |
| Electricity and gas prices for industry | Energy cost in production | Half-yearly | Eurostat[13] |
| Oil market supply, demand and stocks | Context and supply risk | Monthly | IEA[14], EIA[10] |
Industrial energy prices in Romania and the EU
Energy enters every converting step. VLM Poliplast produces in Bucharest, so the table compares Romanian and EU industrial energy prices, in the consumption bands defined by Eurostat.
| Energy source and consumption band | Romania | European Union (27) |
|---|---|---|
| Electricity, annual consumption 2,000 to 19,999 MWh | 172.3 EUR/MWh first half of 2026 | 155.9 EUR/MWh first half of 2026 |
| Natural gas, annual consumption 10,000 to 99,999 GJ | 53.9 EUR/MWh first half of 2026 | 61.6 EUR/MWh first half of 2026 |
Prices for non-household consumers, excluding VAT and other recoverable taxes, latest half-year published for each area. Source: Eurostat, series nrg_pc_205 and nrg_pc_203. Data last retrieved: 17 November 2026, 10:27.
How to budget for packaging when prices move
Part of the market prices packaging with raw-material surcharges or contracts indexed to a polymer or oil benchmark. VLM Poliplast does not: a quoted price is fixed for the order and stays unchanged until that order is complete. The next order receives a new quote.
Within that model, five steps reduce the effect of price swings on a packaging budget:
- Fix the specification. Agree structure, thickness, dimensions, colours and options at the start. Quotes then stay comparable over time and show exactly what changed between two prices.
- Share forecast volumes early. Give a quarterly or annual estimate. The converter then plans material purchases and production ahead.
- Review thickness and structure. Choose a thinner film where the product and the packing line allow it: less polymer per square metre means less exposure to polymer prices. Assess a move to mono-material packaging film separately, on the properties required and the recyclability target.
- Choose the format on total cost. Compare converting costs, which differ between film for a form-fill-seal line and premade pouches. The comparison of rollstock packaging vs premade pouches sets out both routes.
- Consolidate orders. Place larger orders to spread fixed costs over more units, accepting more packaging held in stock.
Get a price on your specification
Send the structure, dimensions, print and estimated annual volume, and the VLM Poliplast team will reply as soon as possible.
Related resources
About the author
Laura Ionescu, CFO VLM Poliplast. This page is based only on the official sources listed under Sources.
Sources
- GOV.UK, Environmental taxes, reliefs and schemes for businesses: Plastic Packaging Tax.
- U.S. Energy Information Administration (EIA), Energy Explained, Uses of hydrocarbon gas liquids, updated 26 December 2023.
- EIA, Today in Energy, U.S. exports of ethane and ethane-based petrochemicals rose 135% from 2014 to 2023, 4 November 2024.
- EIA, Today in Energy, U.S. ethane production, consumption, and exports set new records in 2024, 20 March 2025.
- Eurostat, Producer prices in industry, monthly data (sts_inpp_m), NACE C20.16 and C22.22, EU-27, index 2021=100.
- International Energy Agency (IEA), The Middle East and Global Energy Markets.
- EIA, Global Energy Security Data, Short-Term Energy Outlook supplement, 12 August 2026.
- Natural Earth, Free vector and raster map data at 1:10m scale, public domain.
- EIA, Europe Brent Spot Price FOB, weekly series.
- EIA, Short-Term Energy Outlook, October 2026, released 6 October 2026.
- European Central Bank, Euro foreign exchange reference rates: US dollar.
- European Commission, Directorate-General for Energy, Weekly Oil Bulletin.
- Eurostat, Electricity prices for non-household consumers (nrg_pc_205) and Gas prices for non-household consumers (nrg_pc_203).
- IEA, Oil Market Report (OMR), monthly.
Matching the barrier to the product, not to a datasheet
Send the product, the process it goes through and the shelf life you need. We come back with a structure and the documentation that goes with it.
Related resources
Barrier options and PPWR recyclability
EVOH set against a metallised layer and a ceramic coating, with the design threshold that decides which structure stays in a recycling stream.
Polyethylene as a polymer
The layers that surround an EVOH barrier: what density, comonomer and additives control, and why polyethylene keeps water out but lets oxygen through.
All-PE structures
How a barrier layer is carried inside a single polymer family, and what the structure gives up to stay there.
Multilayer structures
Coextrusion and lamination as two ways of joining layers, and what each one allows a barrier layer to do.